An SFRA test of a transformer does not tell you whether the unit is good. It tells you whether the unit has changed. That distinction explains most of the confusion around frequency response analysis, and why two engineers can look at the same trace and reach opposite conclusions. The curve itself has no pass mark. Only a comparison does.
This guide covers the test as it is actually performed: what the transfer function represents, which faults it sees and which it does not, how the frequency bands shift on small units, the four connection schemes, and how to build a baseline you can still use three years later. If you maintain distribution and small power transformers in the 100 VA to 30 kVA range, the band boundaries and the repeatability advice below matter more than any absolute limit you will find online.
What the SFRA test actually measures
A sweep frequency response analyser injects a low-voltage sinusoidal signal, typically 10 V to 20 V peak to peak, into one terminal of a winding and measures what comes out at another. It repeats that at hundreds or thousands of discrete frequencies on a logarithmic sweep, usually from 20 Hz to 2 MHz, and records magnitude in decibels together with phase.
The result is a transfer function, not a resistance or an impedance reading. A transformer winding behaves as a distributed network of series inductance, series resistance, capacitance between turns and discs, and capacitance to the core and tank. Those elements are fixed by geometry: how far apart the conductors sit, how tightly the winding is clamped, where the leads run. Bend a winding radially, shift it axially, loosen the clamping structure, or move the core, and the inductance and capacitance per section change. Every resonance in the sweep moves with them.
That is the entire physical basis of frequency response analysis. SFRA is a geometry measurement disguised as an electrical one. It is extremely good at detecting mechanical change in a transformer winding and correspondingly poor at detecting chemical or dielectric condition.
What SFRA finds, and what it cannot
Published descriptions list winding deformation, core movement, loose clamping and connection faults together, which suggests SFRA is a general condition test. It is not. The table separates what the method is genuinely sensitive to from what needs a different instrument.
| Durum |
SFRA sensitivity |
Test that actually confirms it |
| Radial or axial winding deformation after a short-circuit event |
Strong, mid band |
SFRA against baseline, then visual inspection if opened |
| Core displacement after transport or seismic event |
Strong, low band |
SFRA, magnetic balance test |
| Loss of clamping preload, loosened spacers |
Moderate, trend only |
SFRA trend over time, vibration and noise survey |
| Broken or loose internal lead, poor tap contact |
Strong, high band |
SFRA per tap position, DC resistance per tap |
| A few shorted turns |
Weak and unreliable |
Turns ratio test, excitation current |
| Moisture in the insulation system |
Yok |
Insulation resistance, dielectric loss, oil moisture |
| Partial discharge activity |
Yok |
PD measurement, dissolved gas analysis |
| Thermal ageing of insulation |
Yok |
Dissolved gas analysis, furans, degree of polymerisation |
The rows near the bottom are the ones buyers overlook. A transformer can be wet, contaminated, gassing and close to failure, and still produce a textbook curve, because nothing about its geometry has changed yet. If an SFRA report is your only evidence of condition, you have evidence of mechanical integrity and nothing else.
Frequency bands, and why they move with transformer size
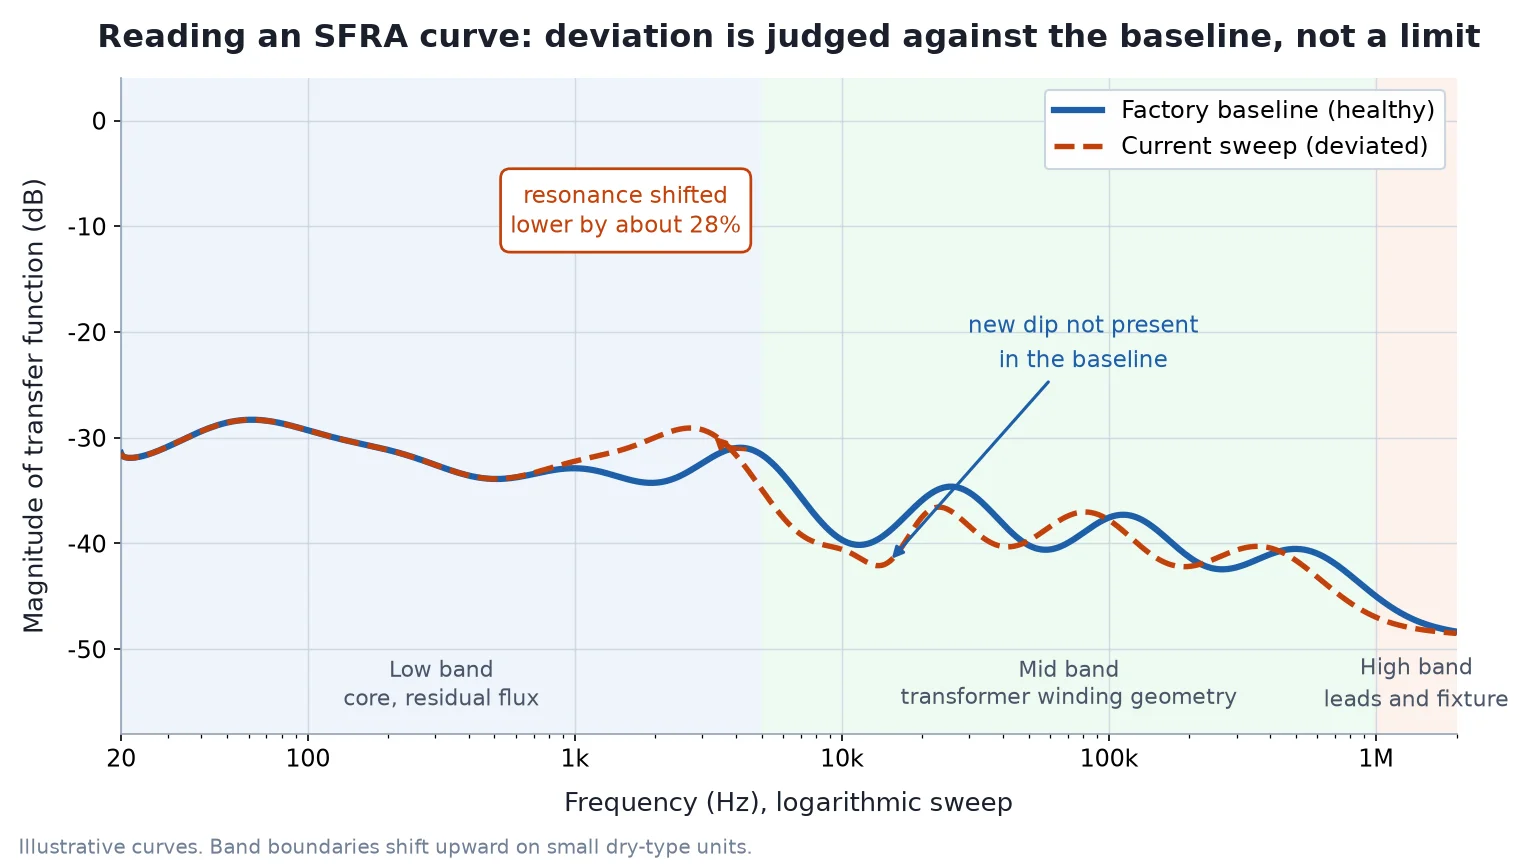
Interpretation is organised by frequency band, and most guides print one band table as though it were universal. It is not. Resonance frequencies scale with the square root of inductance times capacitance, so a smaller transformer with fewer turns and less inter-winding capacitance resonates higher. Applying a 400 kV unit’s band boundaries to a 5 kVA dry-type transformer produces confident and wrong conclusions.
| Band |
What dominates the response |
Large power transformer (MVA class) |
Small dry-type unit (100 VA to 30 kVA) |
| Düşük |
Core magnetising branch, residual flux, grounding quality |
20 Hz to about 2 kHz |
20 Hz to roughly 5 kHz, still dominated by residual flux at the bottom decade |
| Mid |
Winding geometry: axial and radial deformation, inter-turn capacitance |
About 2 kHz to 300 to 400 kHz |
Roughly 5 kHz to 1 MHz, because the winding resonances sit much higher |
| Yüksek |
Leads, tap changer, bushings, and the test fixture itself |
About 400 kHz to 2 MHz |
Above roughly 1 MHz, and often unusable because lead inductance is comparable to winding inductance |
Treat those numbers as orders of magnitude, not acceptance bands. The practical consequence for small units is that the diagnostic window is wider than the literature suggests, and the top of the sweep measures your own test leads. If a report flags a deviation at 1.5 MHz on a 2 kVA transformer, ask what the leads were doing before you ask what the winding was doing.
The four connection schemes
Each scheme excites a different part of the network, and the same unit produces different curves under different schemes. Comparisons are valid only within one scheme, so record the scheme with every test.
| Bağlantı |
How it is set up |
What it emphasises |
Pratik not |
| End to end, open circuit |
Signal into one terminal, measured at the other end of the same winding, all other windings open |
Core behaviour and overall winding displacement |
The default for transport and core-movement checks |
| End to end, short circuit |
Same measurement path, with the other winding shorted |
Leakage inductance and winding geometry, with the core largely removed from the response |
Most sensitive scheme for detecting deformation, and the one to run first after a short-circuit event |
| Capacitive inter-winding |
Signal on one winding, response on another, both ends of each winding connected |
Capacitance between windings, bushings and leads |
Limited value on small units where inter-winding capacitance is tiny |
| Inductive inter-winding |
Signal on one winding, response on another, with the windings configured to couple magnetically |
Relative displacement between windings |
Useful when you suspect the low-voltage winding has moved inside the high-voltage winding |
Procedure: building a test you can repeat
Repeatability, not instrument accuracy, decides whether an SFRA record has any future value. A curve taken with a different cable, ground point or lead dress is not a baseline; it is a new measurement of a different circuit.
- Isolate and discharge. De-energise, lock out, earth and discharge all windings, then remove the earth connections that would short the measurement path. Record ambient temperature and humidity.
- Demagnetise the core if any DC test was run beforehand. The next section explains why this step is not optional.
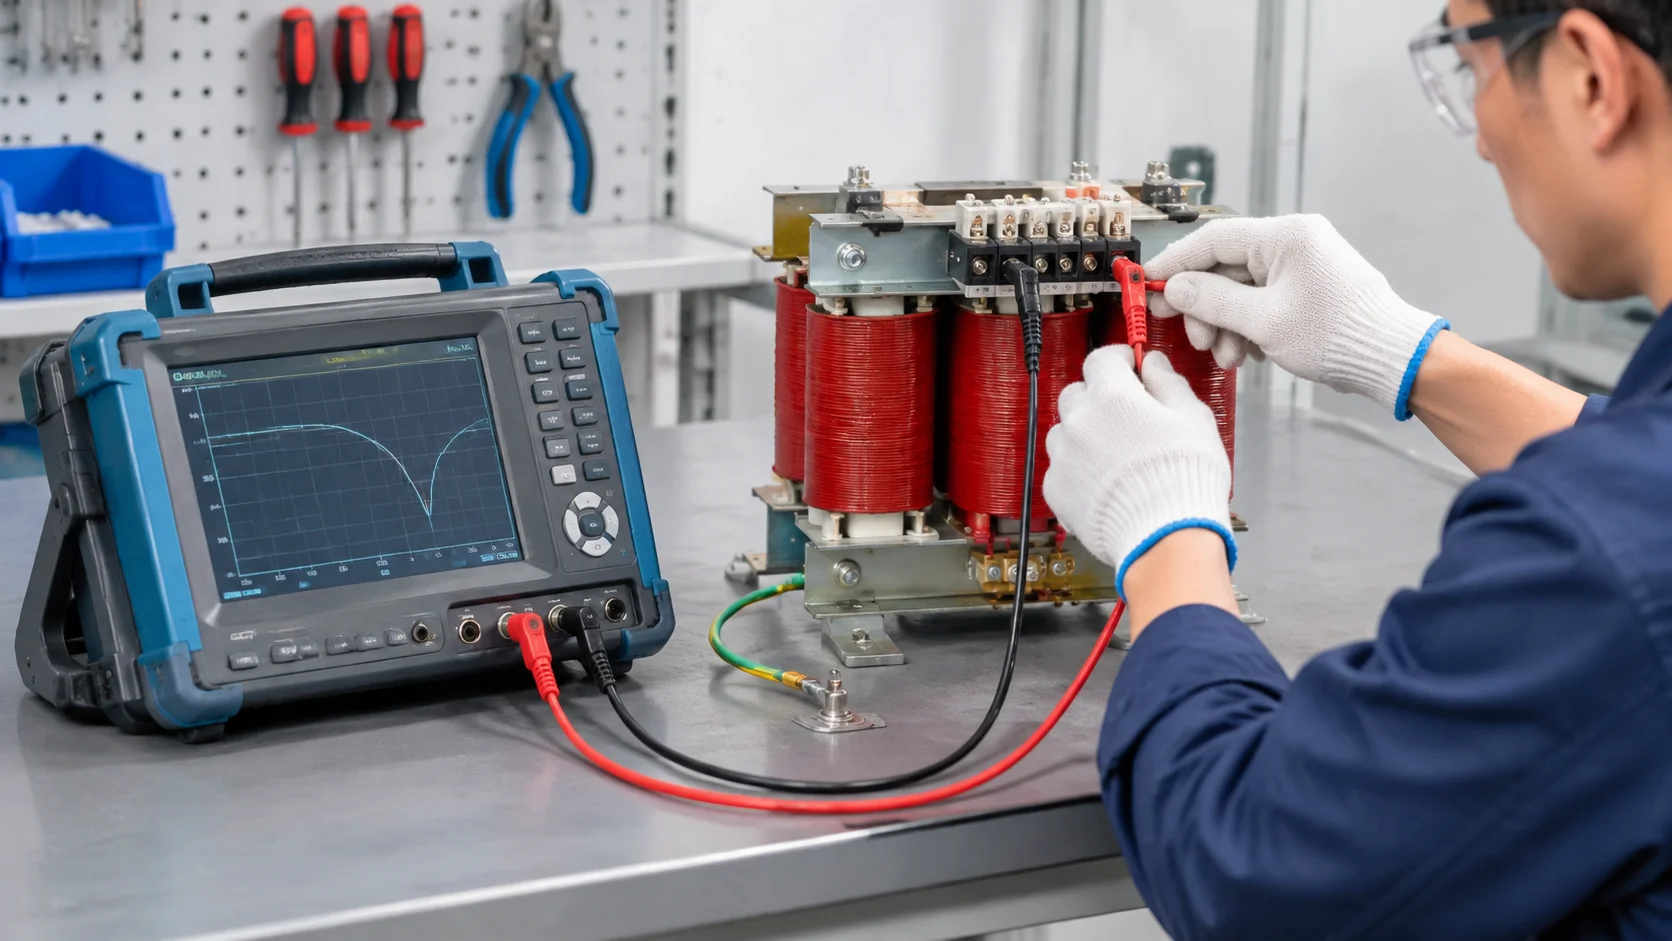
- Fix the fixture. Use the same coaxial leads, the same length, the same routing, the same single-point ground. Photograph the setup and keep the photograph with the data. Mark terminal positions on the unit so the next technician cannot improvise.
- Record the tap position and test at the same tap as the baseline. If you are testing a tap changer, test every position and label each curve.
- Sweep 20 Hz to 2 MHz logarithmically with the analyser’s standard point count. Do not change point count between tests; it changes the apparent resolution of the peaks.
- Save raw data, not screenshots, with serial number, phase, connection scheme, tap, date, ambient conditions and operator.
- Repeat one winding at the end. If the repeat does not overlay the first pass, the fixture moved and nothing else in the report can be trusted. This single step eliminates most bad diagnoses.
Demagnetise before you sweep
A DC resistance measurement leaves residual flux in the core, and residual flux biases the low-frequency end of the sweep. The resulting curve looks like core displacement when nothing has moved. The error is large enough on small units to be mistaken for a fault, and it is entirely avoidable.
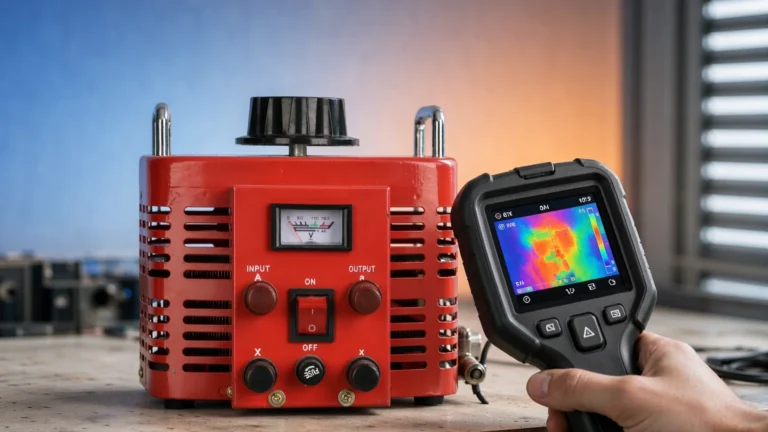
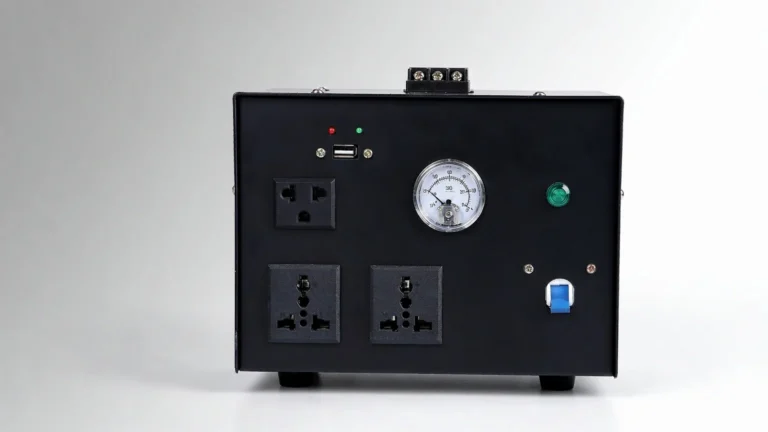
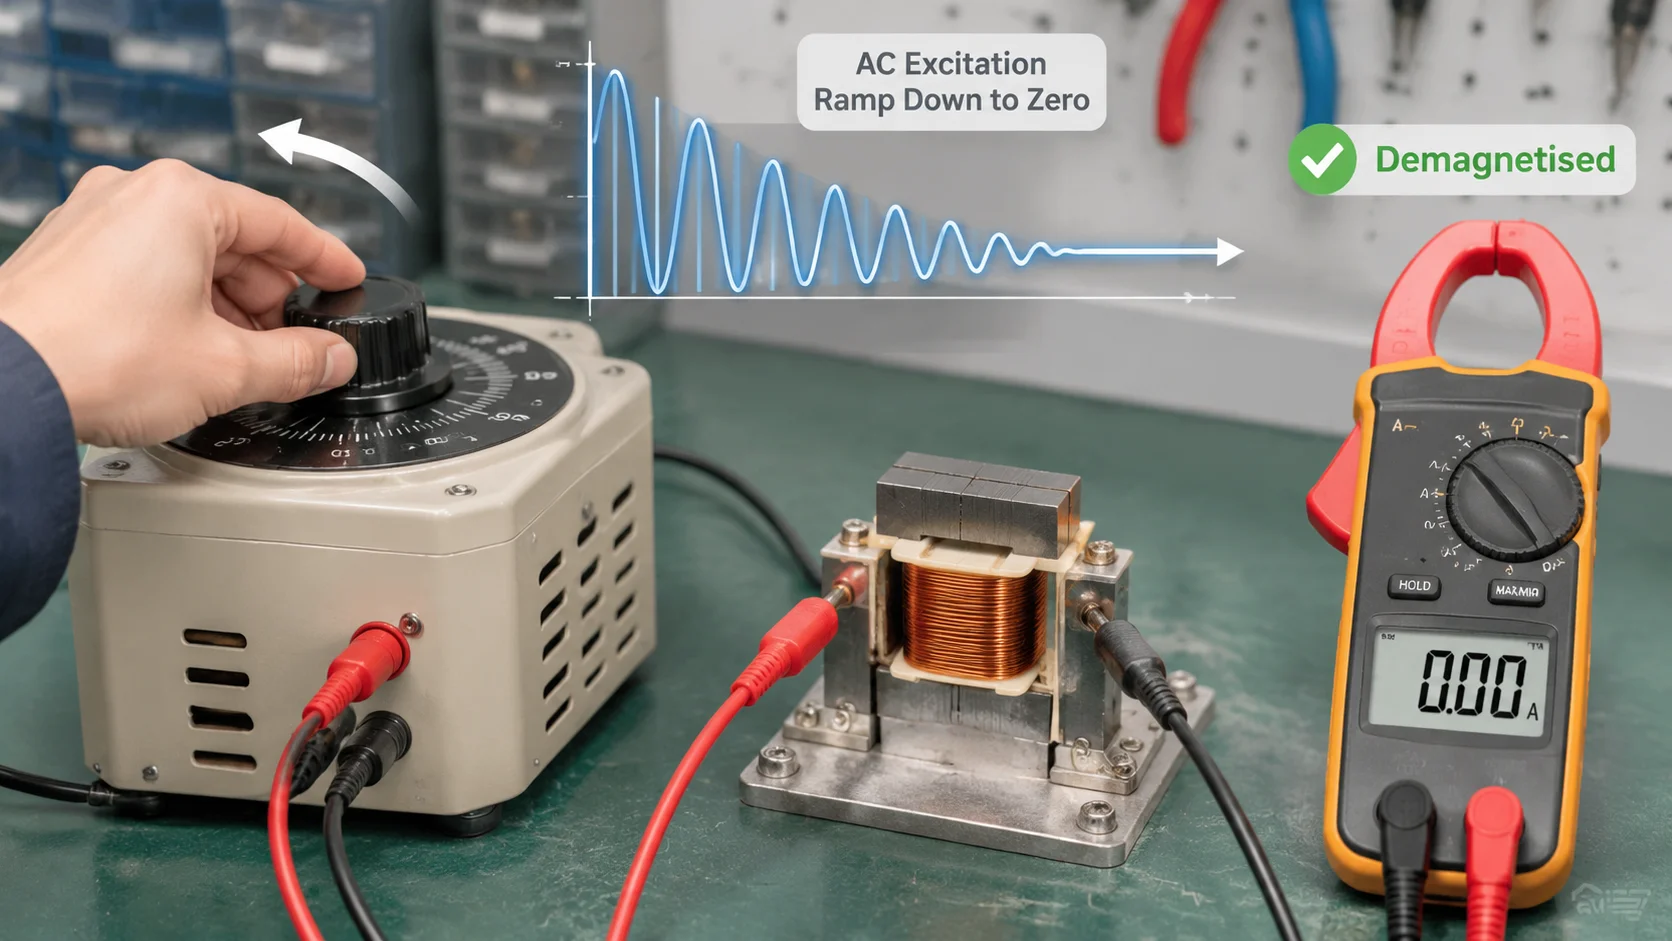
On a bench, the practical method is to apply a reduced AC voltage across a winding and then reduce it continuously to zero. A variable transformer such as the TDGC2J series is the right tool for this because the output can be wound down smoothly rather than switched off in steps. Switching off at a fixed tap leaves a substantial remanent flux; ramping to zero does not.
Confirm the result before you sweep. A demagnetised core draws a symmetrical, low no-load current; a magnetised one draws an asymmetric current with a DC component that a clamp meter shows within seconds on a small unit. If the current is lopsided, repeat the ramp-down.
Reading the curve without pass/fail numbers
There is no numerical acceptance limit for SFRA. IEC 60076-18 defines the measurement method and connection schemes, and DL/T 911 does the same for the Chinese grid, but neither provides a decibel threshold above which a transformer fails. Assessment is comparative and region-based, which is why the quality of your reference data decides the quality of the diagnosis.
Rank the available references in this order, because each is weaker than the one before it:
- The unit’s own factory baseline. The strongest reference, and the reason to ask for the FAT record at purchase.
- A sister unit of the same design from the same production run.
- The unit’s own previous test, taken with the same fixture.
- Phase-to-phase symmetry on a three-phase unit. Useful, but never expect a perfect overlay.
That matters on small three-phase transformers. In a three-limb core the centre limb has a different magnetic return path, so phase B never matches A and C exactly, even on a healthy unit. Demanding a perfect overlay creates false alarms. Establish the asymmetry on a known-good unit of the same design and use that as your reference shape. A magnetic balance test is a useful companion, because it measures the flux distribution that produces the asymmetry.
Before interpreting any deviation, measure your own noise floor. Test the same winding twice and note the spread between the curves. Anything smaller than two to three times that spread is not a finding, however alarming it looks zoomed in. Read the phase trace too: a phase discontinuity where the magnitude barely moved is often the first sign of a changed resonance.
Baseline discipline: what to record
An SFRA record is only worth what its metadata is worth. Store the following with every curve, somewhere that survives staff turnover rather than on one laptop.
| Field |
Why it matters later |
| Serial number and rating |
Prevents the most common error, comparing two different units |
| Connection scheme and phase |
Curves are only comparable within one scheme |
| Tap position |
A tap change moves the mid band more than most faults do |
| Lead type, length and routing, plus a photograph |
The dominant source of high-frequency variation |
| Ground point location |
The second most common source of false positives |
| Ambient temperature and humidity |
Affects repeatability, and needed for any trend argument |
| Demagnetisation performed, yes or no |
Explains low-band shifts that are not faults |
| Instrument model and firmware |
Different analysers do not produce identical curves |
False positives worth ruling out first
Most high-frequency anomalies in field reports trace back to the test setup, not the transformer. Before escalating a deviation, check that the grounding strap is firmly connected to bare metal on the tank, that the braid is short and flat rather than coiled, that the leads have not been re-routed or swapped, and that the tap has not moved since the baseline. Re-run the sweep with the fixture corrected. If the deviation disappears, it was never a transformer problem.
Is SFRA worth the cost on a small transformer?
For a 100 VA to 30 kVA unit, a commercial SFRA survey can cost a meaningful fraction of the transformer itself. That changes the order in which tests should be run.
| Durum |
Reasonable approach |
| New unit arriving on site, value under a few thousand dollars |
Insulation resistance, dönüş oranı, DC resistance, no-load current, then a physical and audible inspection. SFRA adds little unless the unit was shipped a long distance or dropped. |
| Unit feeding a critical panel or medical load |
Record an SFRA baseline once, while healthy. The value is in the future comparison, not the first curve. |
| Unit has survived a short-circuit event or a lightning strike |
Run the short-circuit scheme first. This is the case where SFRA earns its cost. |
| Transformer is 20 years old and you are deciding on replacement |
SFRA tells you about mechanical condition only. Pair it with insulation and oil data, or the decision rests on half the evidence. |
Where the test fee approaches the price of the asset, spending it on a spare unit or a documented baseline is usually the better engineering decision. The mechanical failure modes SFRA detects are rare in small dry-type transformers that have never seen a severe fault; dielectric and thermal failures are the common ones, and this method cannot see them.
Sonuç
SFRA is a precise instrument for a narrow question: has the internal geometry of this transformer changed since the reference curve was taken? Answer it with a consistent fixture, a demagnetised core, a recorded tap position and a reference you trust, and the test is genuinely powerful. Skip any of those and the curve becomes an expensive source of false alarms. If you want the factory baseline records that make future SFRA useful, talk to our engineering team about what ships with each unit.
SSS
How long does an SFRA test take?
A single winding under one connection scheme takes a few minutes on modern analysers. A complete survey of a three-phase unit across the main schemes typically runs 15 to 30 minutes, plus setup and demagnetisation time.
Is SFRA testing destructive?
No. The excitation is a low-voltage signal of roughly 10 V to 20 V peak to peak, which places no stress on the insulation. The test is performed de-energised and offline.
Can you do an SFRA test without a baseline?
Yes, but the conclusion is weaker. Without a baseline you rely on a sister unit or on three-phase symmetry, both of which introduce uncertainty. A curve with no reference can confirm a gross problem and cannot confirm health.
What is the difference between SFRA and DFRA?
SFRA sweeps continuously across a frequency range and produces a dense curve. DFRA measures at a limited set of discrete frequencies. SFRA is the current standard because closely spaced resonances can be missed between discrete points.
Will SFRA detect a shorted turn?
Not reliably. A small number of shorted turns may barely move the geometry-dependent response, so a turns ratio test and an excitation current measurement remain the correct tools for that fault. SFRA is for mechanical change, not for winding faults in the conventional sense.
Which standard covers SFRA?
IEC 60076-18 covers frequency response measurement on power transformer windings, including connection schemes and interpretation guidance. DL/T 911 is the equivalent reference used for grid transformers in China. Neither standard sets a numeric pass threshold.
Does the transformer need to be disconnected?
Yes. The unit must be de-energised, isolated, locked out and discharged, and the measurement path must be free of earth connections that would short the signal. Busbar and cable connections at the terminals should be removed.